Elastic Architects designed the distributed Elasticsearch platform to follow NoSql principles. In the traditional Relational Database Management System (RDBMS) world, SQL databases use GROUP BY syntax to group rows with similar values into summary rows. The query, "find the number of web page hits per country," for example, represents a typical GROUP BY operation.
Witness the following table, which records the number of hits to my site John.Soban.ski, broken down by time zone.
| COUNTRY | TIMEZONE | HITS |
|---|---|---|
| United States | America/New_York | 11909 |
| United States | America/Chicago | 9137 |
| United States | America/Los_Angeles | 7745 |
| United States | America/Denver | 867 |
| United States | America/Phoenix | 313 |
| India | Asia/Kolkata | 10227 |
| United Kingdom | Europe/London | 5100 |
| Germany | Europe/Berlin | 4567 |
| France | Europe/Paris | 3682 |
We can further summarize the table to record "hits per country" via a GROUP BY operation. This operation collapses the Timezones into their parent countries.
SELECT COUNTRY, SUM(HITS) FROM timezone_hits GROUP BY COUNTRY;
| COUNRTY | SUM(HITS) |
|---|---|
| United States | 30296 |
| India | 10227 |
| United Kingdom | 5100 |
| Germany | 4567 |
| France | 3682 |
Even though Elasticsearch does not use the row construct to identify a unit of data (Elastic calls their rows Documents), we can still perform GROUP BY queries in Elasticsearch. Elasticsearch names their GROUP BY queries Aggregations.
The Elasticsearch API provides an expressive REST API to execute Aggregations. Kibana also provides a Graphical User Interface (GUI) to execute Aggregations. We will demonstrate both methods in this blog post.
Aside 1: Get Cloudfront logs into Elasticsearch
I ingested my AWS Cloudfront logs from S3 into Elasticsearch using Logstash. I first set up an Elasticsearch cluster using the method I recorded in last mont's blog post, which describes how to use Boto3 to connect an Ubuntu EC2 instance to the Amazon Elasticsearch Service.
A quick Google search lead me to the following filter, which I deployed to my Logstash instance.
When I ingested some logs off the object store, I received the following error:
[2020-06-27T14:30:44,159][WARN ]
[logstash.outputs.amazonelasticsearch]
[main]
Could not index event to Elasticsearch.
{:status=>400, :action=>["index", {:_id=>nil, :_index=>"sobanski-logs-2020-06-27", :_type=>"_doc", :_routing=>nil}, #<LogStash::Event:0x6fe783eb>], :response=>{"index"=>{"_index"=>"sobanski-logs-2020-06-27", "_type"=>"_doc", "_id"=>"o5cWFXMBWUcBmlRpNplG", "status"=>400, "error"=>{"type"=>"mapper_parsing_exception", "reason"=>"failed to parse field [listener_timestamp] of type [date] in document with id 'o5cWFXMBWUcBmlRpNplG'. Preview of field's value: '2020-06-01 00:11:40'", "caused_by"=>{"type"=>"illegal_argument_exception", "reason"=>"failed to parse date field [2020-06-01 00:11:40] with format [strict_date_optional_time||epoch_millis]", "caused_by"=>{"type"=>"date_time_parse_exception", "reason"=>"Failed to parse with all enclosed parsers"}}}}}}
Upon a closer read, I saw:
"failed to parse date field [2020-06-01 00:11:40]
with format [strict_date_optional_time||epoch_millis]"
Put another way, by default Logstash expects a time field to be either epoch miliseconds or in the format yyyy-MM-dd. The parser generates a timestamp in the format yyyy-MM-dd HH:mm:ss, which records the time of day that the log arrived from Cloudfront.
To prevent this error, create an index template for your index, prior to ingesting the Cloudfront logs.
PUT sobanski-logs-2020-06-27/
{
  "mappings" : {
    "properties" : {
      "listener_timestamp" : {
        "type" : "date",
        "format": "yyyy-MM-dd HH:mm:ss||yyyy-MM-dd||epoch_millis"
      }
    }
  }
}
After putting in the mapping template into Elasticsearch, I added some safety checks to the logstash filter. I added logic to drop the comments from the logs, and added a reverse DNS lookup:
filter {
  grok {
    match => ["message", "%{YEAR:year}-%{MONTHNUM:month}-%{MONTHDAY:day}[ \t]%{TIME:time}[ \t]%{DATA:x_edge_location}[ \t](?:%{NUMBER:sc_bytes}|-)[ \t]%{IP:c_ip}[ \t]%{WORD:cs_method}[ \t]%{HOSTNAME:cs_host}[ \t]%{NOTSPACE:cs_uri_stem}[ \t]%{NUMBER:sc_status}[ \t]%{GREEDYDATA:referrer}[ \t]%{NOTSPACE:user_agent}[ \t]%{GREEDYDATA:cs_uri_query}[ \t]%{NOTSPACE:cookie}[ \t]%{WORD:x_edge_result_type}[ \t]%{NOTSPACE:x_edge_request_id}[ \t]%{HOSTNAME:x_host_header}[ \t]%{URIPROTO:cs_protocol}[ \t]%{INT:cs_bytes}[ \t]%{NUMBER:time_taken}[ \t]%{NOTSPACE:x_forwarded_for}[ \t]%{NOTSPACE:ssl_protocol}[ \t]%{NOTSPACE:ssl_cipher}[ \t]%{NOTSPACE:x_edge_response_result_type}([ \t])?(%{NOTSPACE:cs_protocol_version})?"]
    }

  if "_grokparsefailure" in [tags] { drop {} }

  geoip { source => "c_ip" }

  if [year]{
    mutate {
      add_field => ["listener_timestamp", "%{year}-%{month}-%{day} %{time}"]
    }
    date {
           match => ["listener_timestamp", "yyyy-MM-dd HH:mm:ss"]
    }
  }

  dns { reverse => [ "c_ip" ] }

}
Aside 2: Why learn the Elasticsearch Aggregation API?
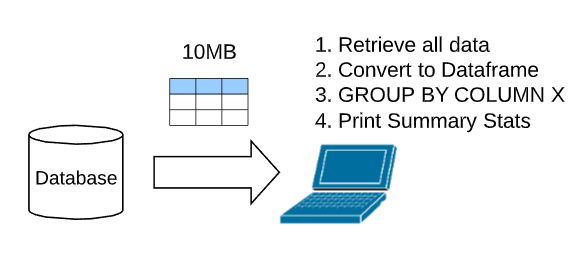
You know and love Pandas. The Elasticsearch aggs API appears to be bizarre and scary. For now, you query Elasticsearch, convert the returned JSON to a Pandas Dataframe, and then apply a Pandas GROUP BY to the Dataframe to retrieve summary stats. Modern laptops include 32GB of memory and you have had no issues with this method. If you use Elasticsearch for non time series data, e.g. static data for blogs, you may not need to worry about running out of memory.
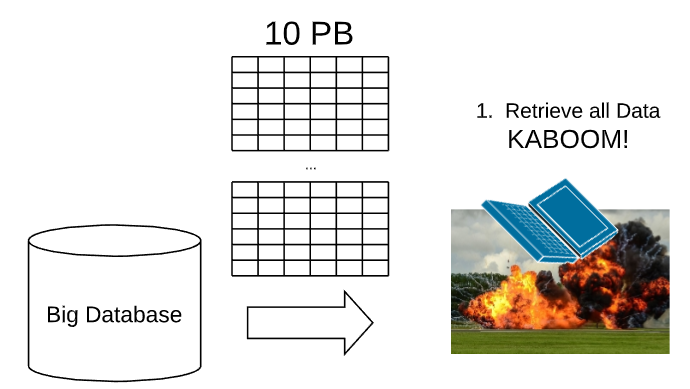
In the future, you may deal with Big Data. If you collect time series data, such as access logs, or security logs, you might scale to Big Data. In that case, the Elasticsearch database size will exceed the memory of your laptop.
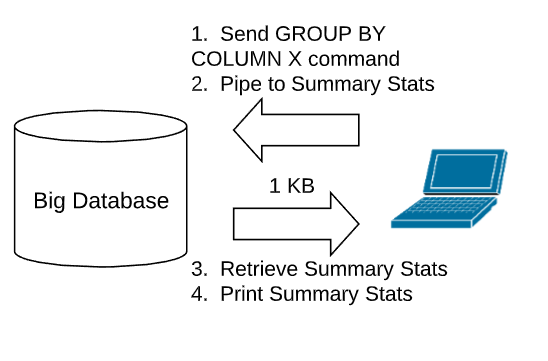
I recommend that you learn the aggs API. This allows you to command Elasticsearch to execute the GROUP BY analouge in-stu (a best practice), and then also apply the summary stats in place. Elasticsearch will then return the summary stats as JSON, and you will not run out of memory.
Aggs
Simple Tables
In the upper right corner of Kibana, select the appropriate time range.
Select Visualization --> Create New Visualization
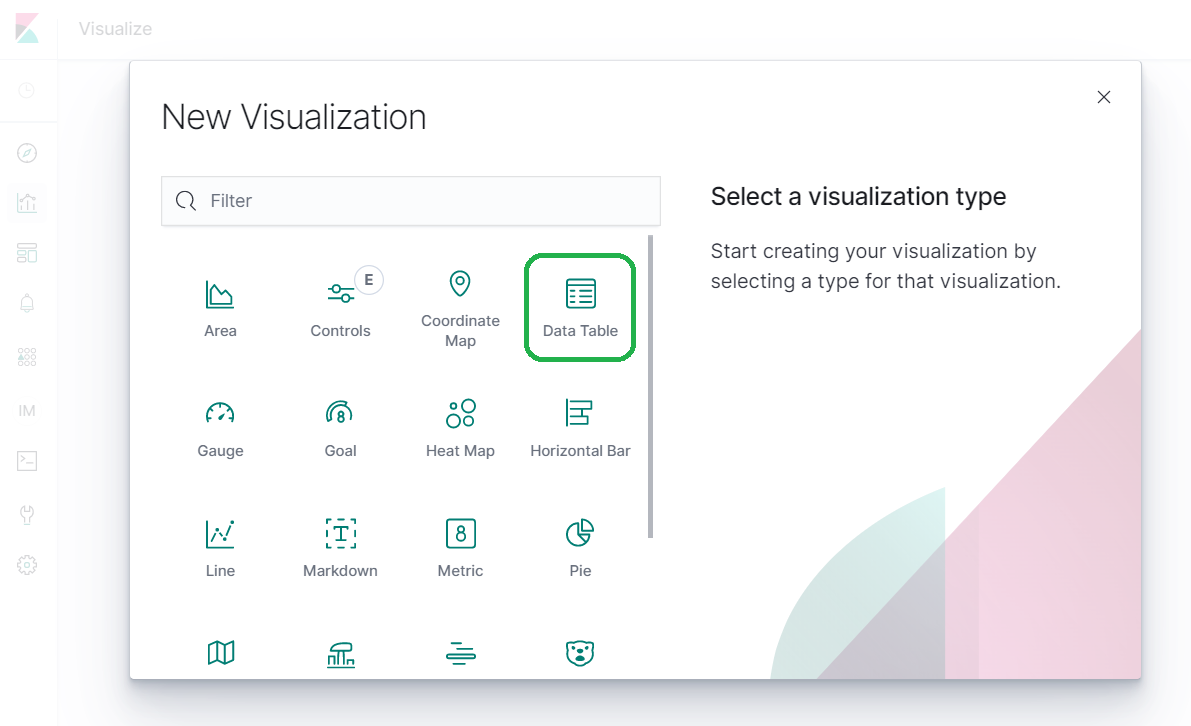
Select Data Table and then pick the name of your index.
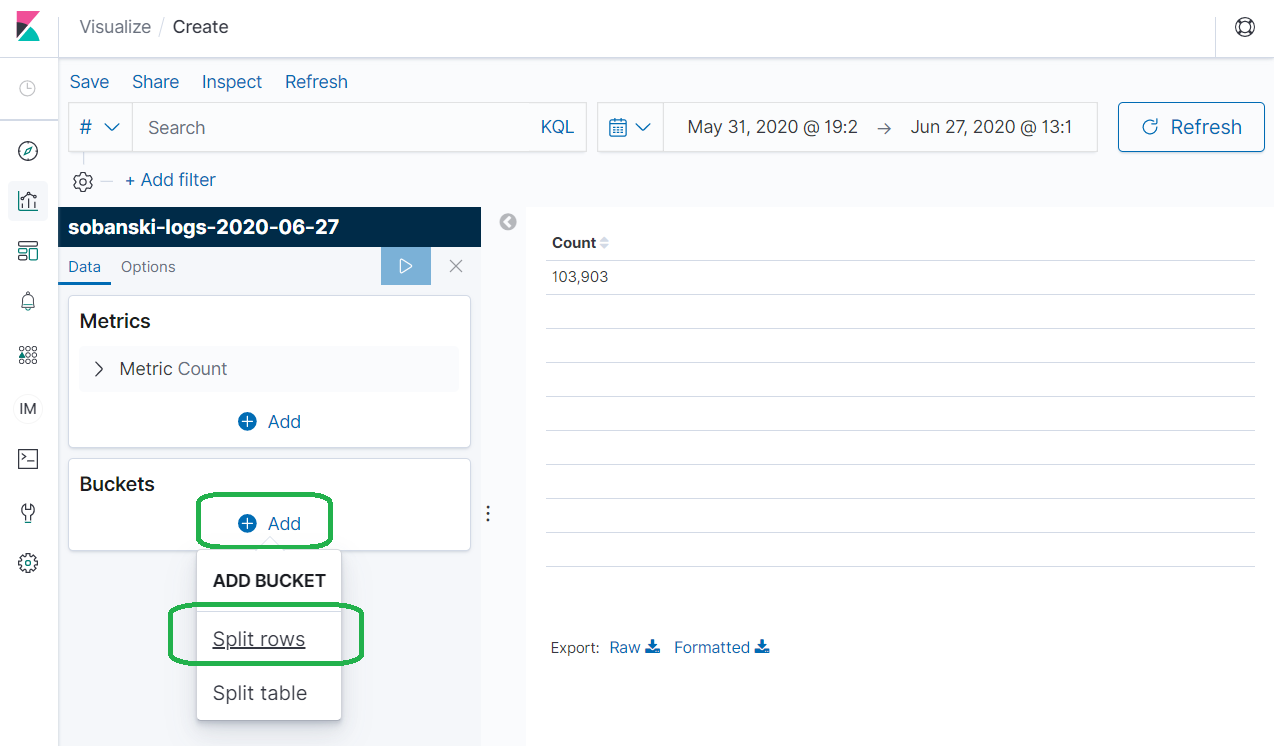
Elasticsearch organizes aggregations into Metrics and Buckets. Leave Metrics to the default of count (hits), and expand Buckets. Click Split rows.
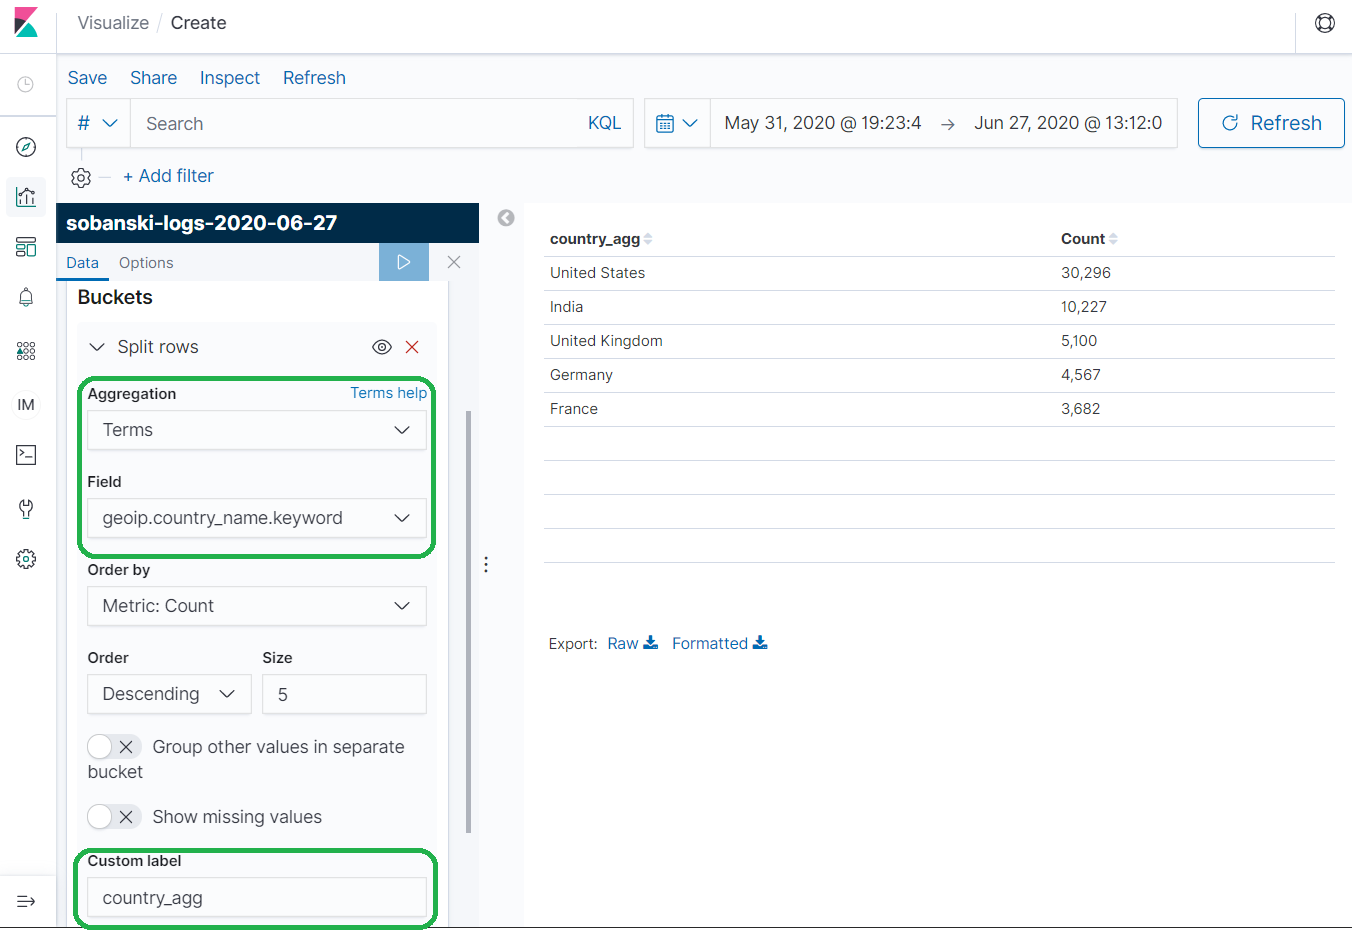
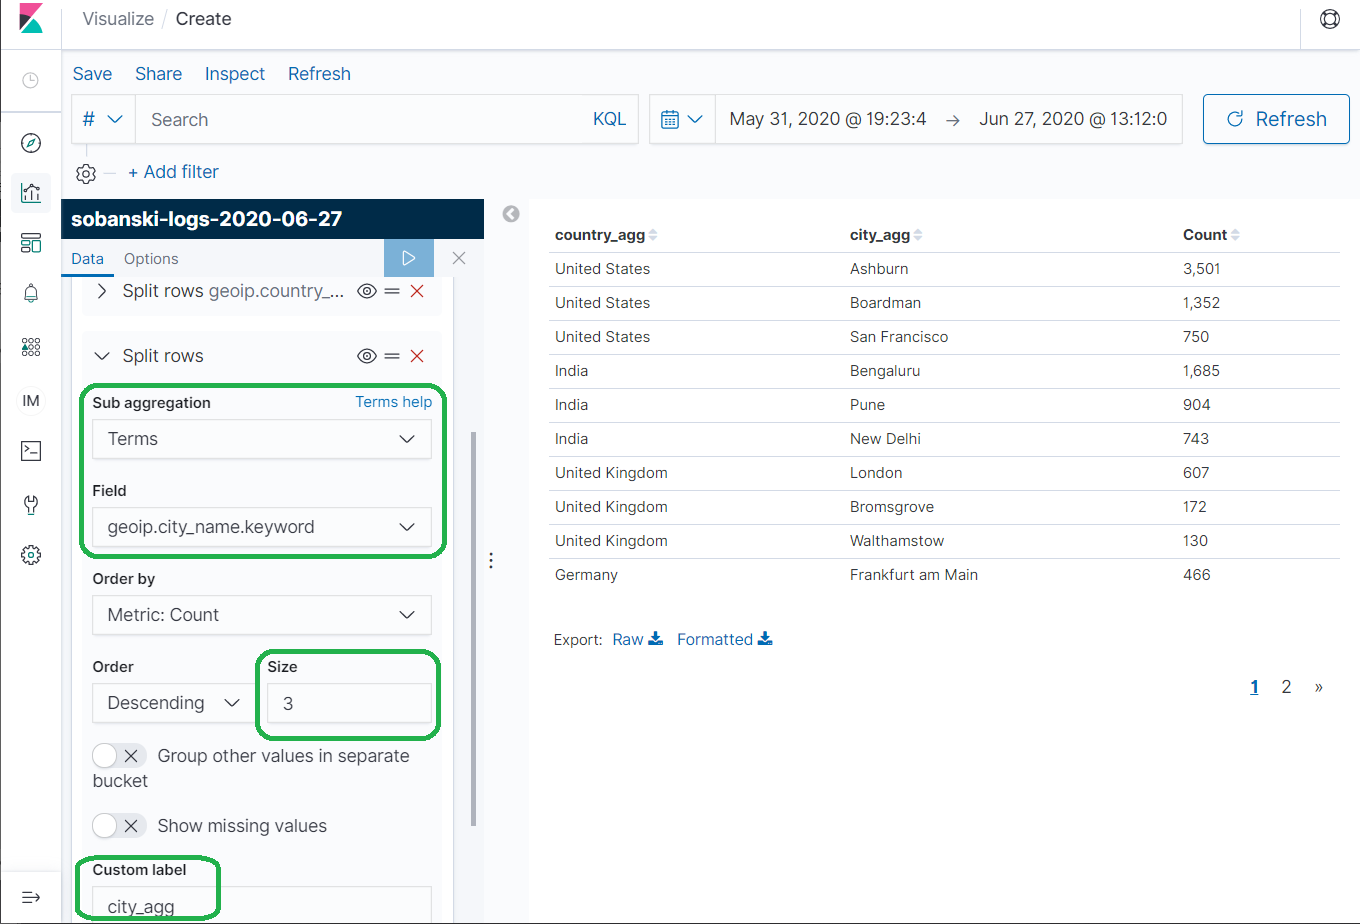
Under Aggregation select Terms (A categorical bucketization) and then under Field select geoip.country_name.keyword. Type country_agg under Custom label and press the Play icon. The results show the hits per country over the month of June.
Nested Tables
Elasticsearch created five big Country buckets based on the number of hits: (1) United States (2) India (3) United Kingdom (4) Germany and (5) France. Now command Elasticsearch to create three little City buckets for each of the five big Country buckets, based on the most active Cities.
Collapse the first Split row and click add. An Add Sub-bucket menu pops up. Once more, click Split Rows. Select Terms for Sub Aggregation and geoip.city_name.keyword for Field. Set Size to 3. Under Custom Label enter city_agg and press the Play icon to apply changes.
Use the API
Now that you have some exposure to the terminology and structure of Elasticsearch Aggregations we will move from the Visualization GUI to the REST API.
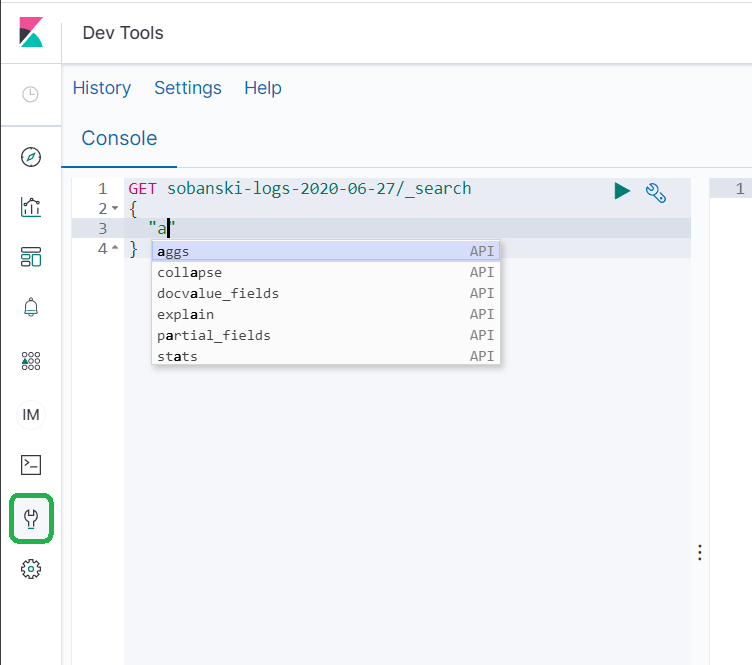
In Kibana, select the Dev Tools icon and then type the following:
Note: Be sure to replace the name sobanski-logs-2020-06-27 with the name of your Cloudfront log index
You will see that after you type quote followed by an a, an aggs auto-complete suggestion menu pops up.
Select the aggs suggestion and Dev tools populates the Dev Tools console with the following JSON.
GET sobanski-logs-2020-06-27/_search
{
  "aggs": {
    "NAME": {
      "AGG_TYPE": {}
    }
  }
}
In the Visualization GUI section above, we set Aggregation to Terms. We also set Custom name to country_agg. To match that workflow, set NAME to country_agg and AGG_TYPE to (lowecase) terms in the auto-complete provided JSON, as follows:
GET sobanski-logs-2020-06-27/_search
{
  "aggs": {
    "country_agg": {
      "terms": {}
    }
  }
}
As you type the lowercase text terms into the Dev Tools supplied JSON stanza, the auto-complete menu pops up.
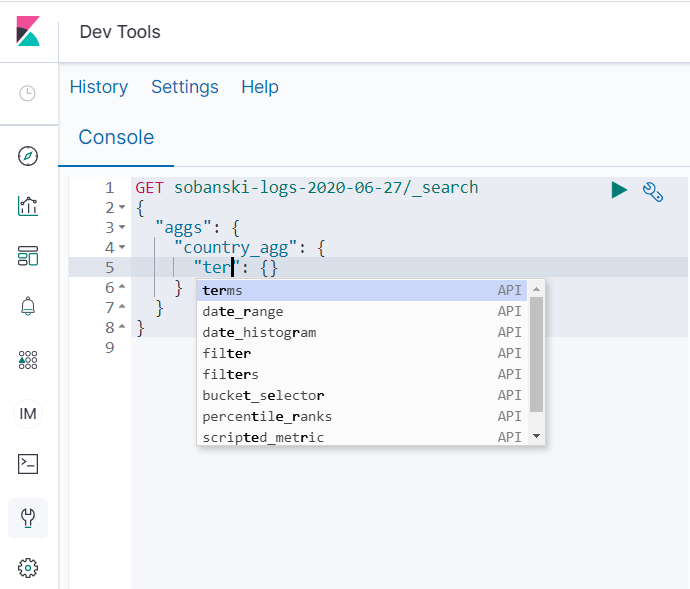
If you select terms, auto-complete provides the following form:
GET sobanski-logs-2020-06-27/_search
{
  "aggs": {
    "country_agg": {
      "terms": {
        "field": "",
        "size": 10
      }
    }
  }
}
As in the Visualization GUI section above, select geoip.country_name.keyword for field. If you click the two empty quotes to the right of the field colon, auto-complete provides an assist. Begin to type country and the pop-up provides selections.
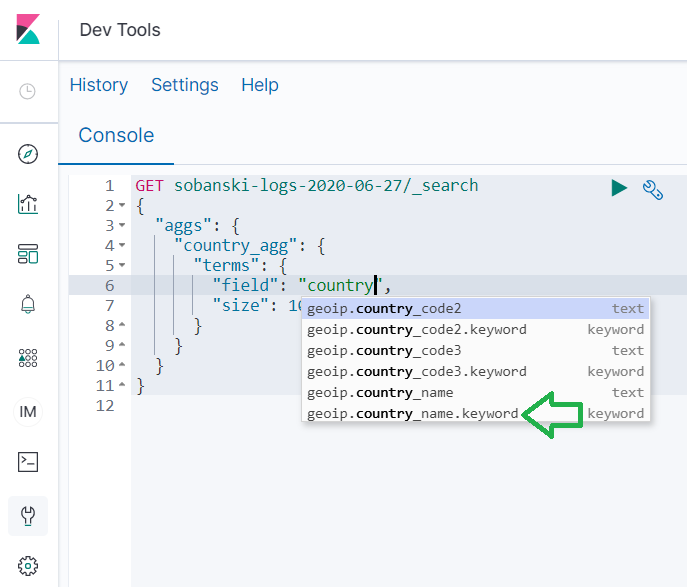
Select geoip.country_name.keyword, set size to 5 and press play.
The query returns a lot of gobbledygook.
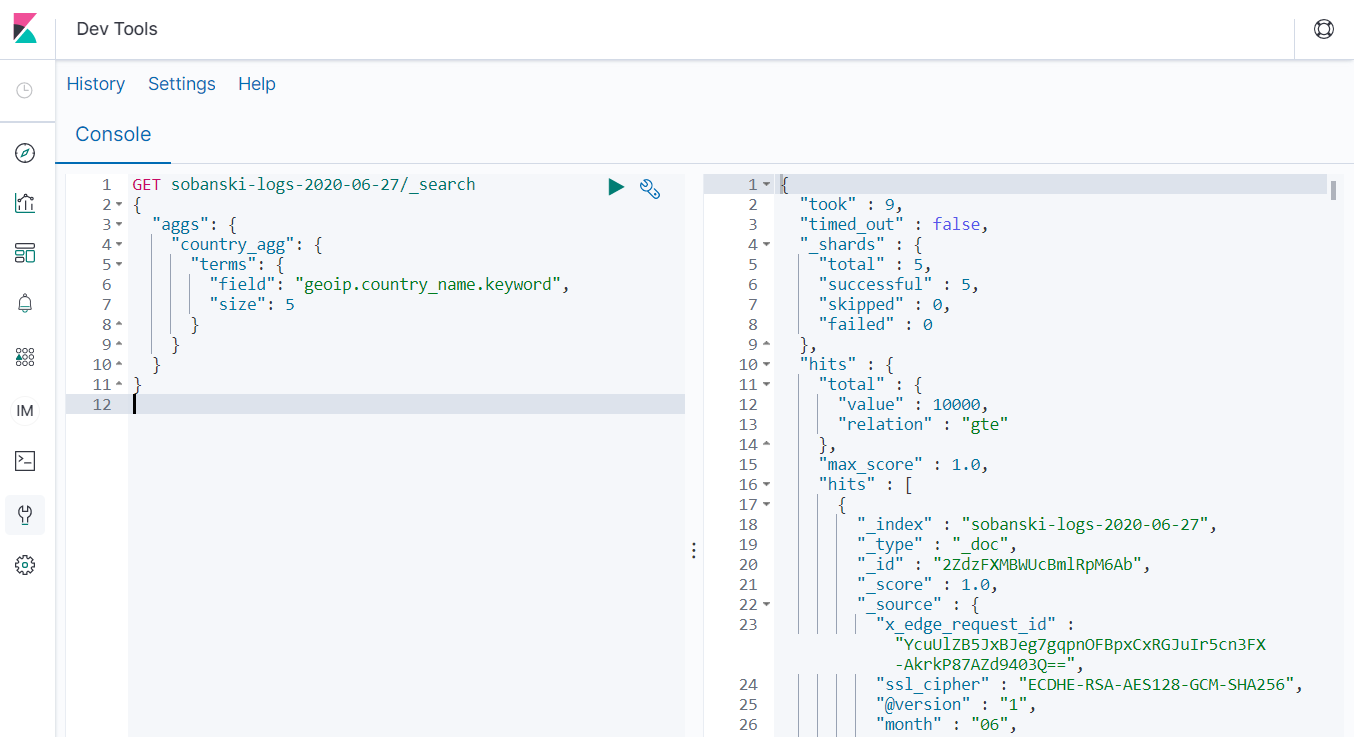
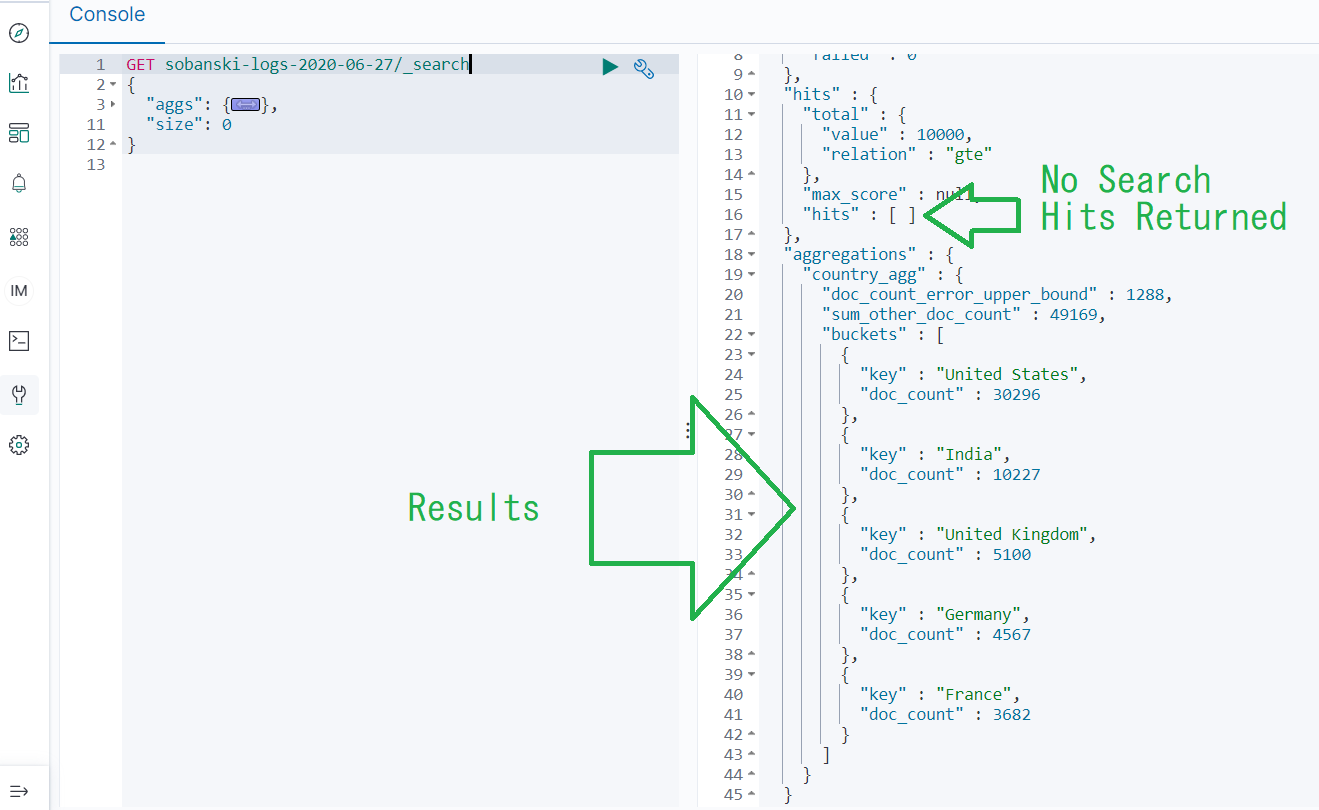
Elasticsearch by default returns search hits with the aggs query. You have two options, (1) Scroll down to the bottom to see the aggs results or (2) Command Elasticsearch not to return search hits via the size parameter. I will demonstrate method (2) now.
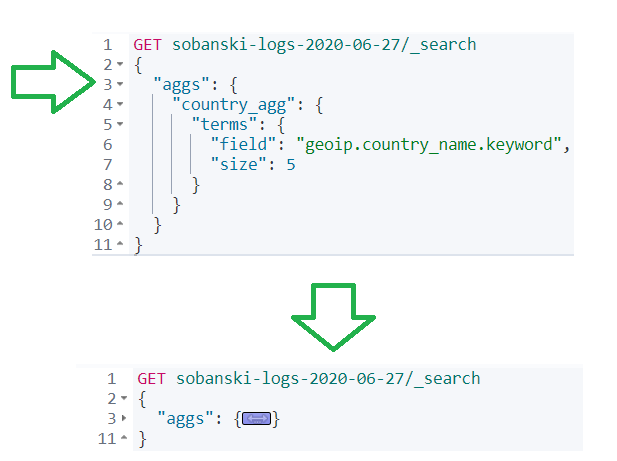
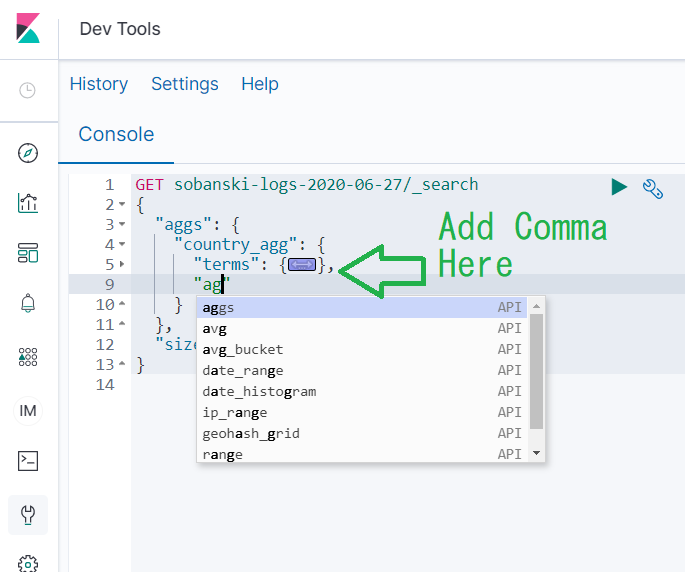
I like to collapse JSON stanzas to ensure that I edit the correct section. Click the caret next to the aggs stanza and Dev Tools collapses the field.
Add a comma right after aggs and hit return. Type a quote and then begin to type size, once more auto-complete suggests the field.
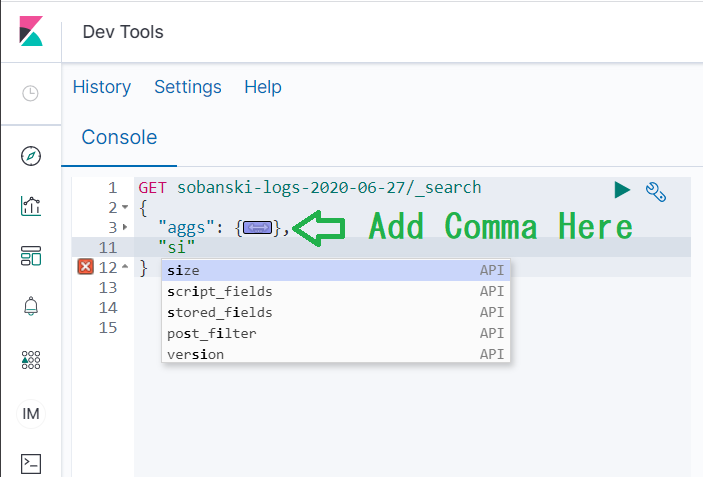
Set size from 20 to 0 and press play. You now see the aggs results.
Nested Aggs via the API
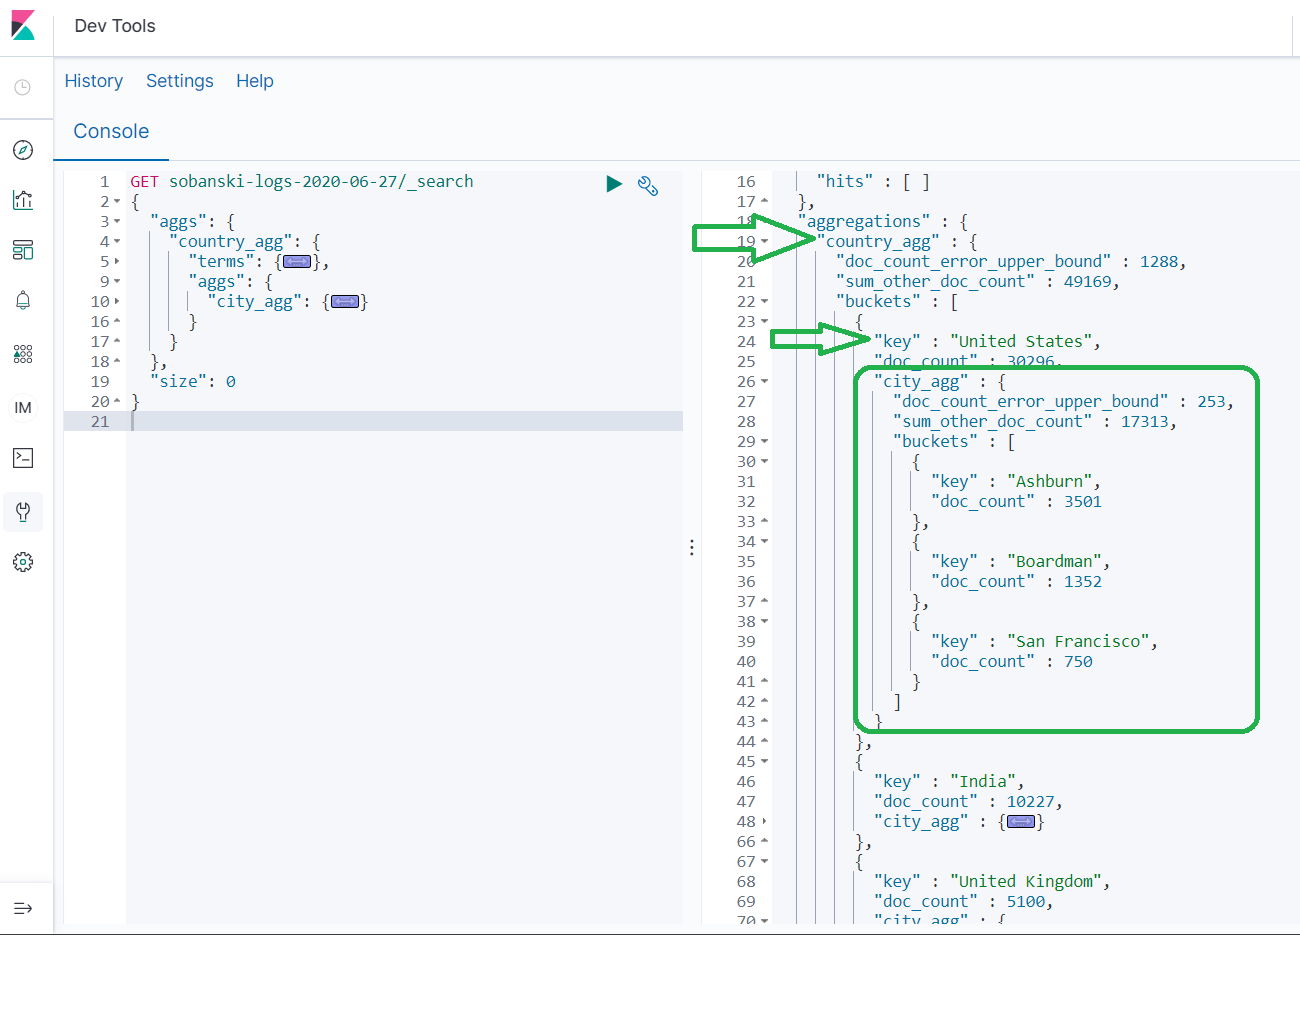
Look at our nested Table from the Kibana example above.
We can create the same table via the API, using nested aggregations. The Elasticsearch Documentation provides the structure the nested agg query must follow.
"aggregations" : {
    "<aggregation_name>" : {
        "<aggregation_type>" : {
            <aggregation_body>
        }
        [,"meta" : {  [<meta_data_body>] } ]?
        [,"aggregations" : { [<sub_aggregation>]+ } ]?
    }
    [,"<aggregation_name_2>" : { ... } ]*
}
I found it a little tricky to edit the JSON by hand. I just need to remember that the big bucket (Country) contains the little bucket (City). In the same manner, the big aggs field contains the little aggs field.
Un-collapse the aggs stanza. In this stanza you will see a country_agg field with a child object of AGG_TYPE set to terms.
GET sobanski-logs-2020-06-27/_search
{
  "aggs": {
    "country_agg": {
      "terms": {
        "field": "geoip.country_name.keyword",
        "size": 5
      }
    }
  },
  "size": 0
}
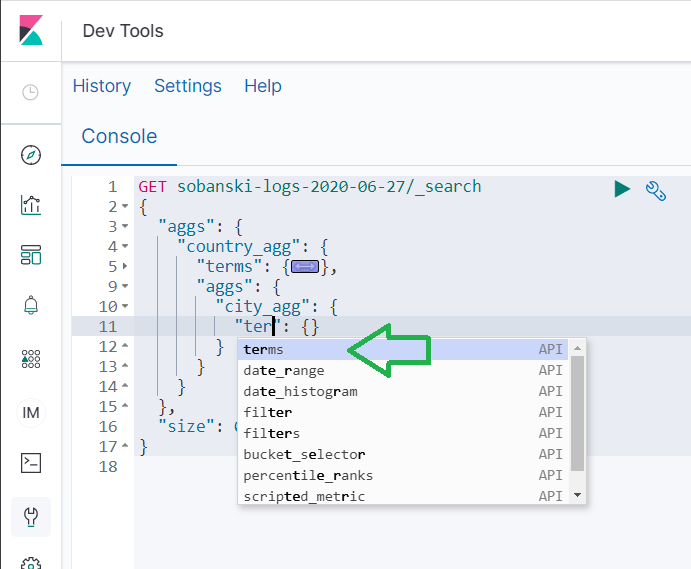
To nest, we want to stick another aggs query under country_agg after our terms aggregation.
To make life easy, collapse the terms field.
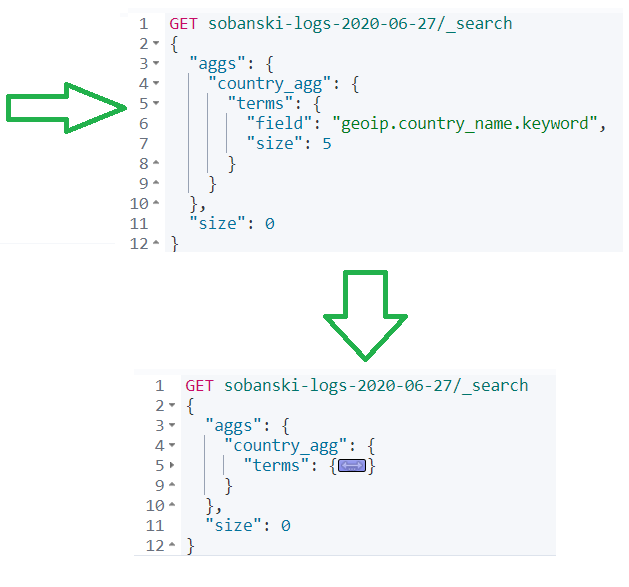
Add a comma after terms and then type a quote followed by aggs. If you see the auto-complete, then you are in the right spot.
Note: If you do not see the auto-complete then double check that you are editing the correct spot.
Select aggs and auto-complete populates:
GET sobanski-logs-2020-06-27/_search
{
  "aggs": {
    "country_agg": {
      "terms": {
        "field": "geoip.country_name.keyword",
        "size": 5
      },
      "aggs": {
        "NAME": {
          "AGG_TYPE": {}
        }
      }
    }
  },
  "size": 0
}
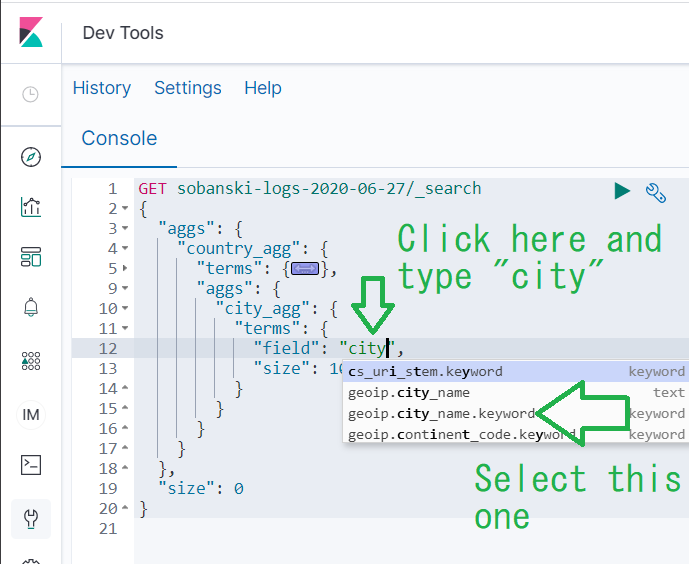
If you remember from the Visualization GUI example above, we selected Terms for Sub Aggregation and entered city_agg for Custom Label. Enter city_agg for NAME and begin to type terms into AGG_TYPE.
Select terms from the auto-complete menu and Dev tools produces:
GET sobanski-logs-2020-06-27/_search
{
  "aggs": {
    "country_agg": {
      "terms": {
        "field": "geoip.country_name.keyword",
        "size": 5
      },
      "aggs": {
        "city_agg": {
          "terms": {
            "field": "",
            "size": 10
          }
        }
      }
    }
  },
  "size": 0
}
Under city_agg change size from 10 to 3. Then, click between the two empty quotes after field and type in city. Click geoip.city_name.keyword.
When you click play, Dev Tools returns the same results the Kibana UI returned.
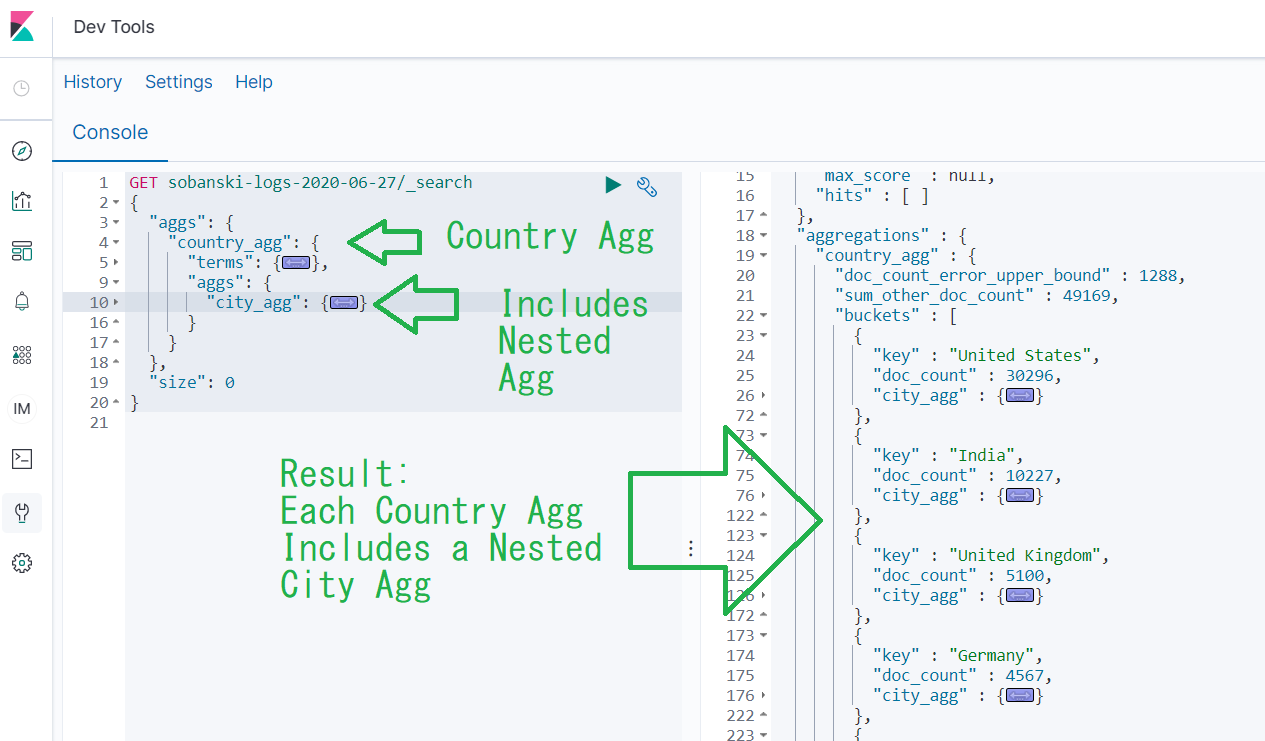
If you expand the city_agg for one of the country_agg buckets, you will find three cities.
Conclusion
In this blog post I demonstrated how to execute simple GROUP BY operations via Elasticsearch aggregations. I demonstrated how to generate tables via both Kibana and the Elasticsearch API. GROUP BY (RDBMS) and Aggregation (Elasticsearch) operations lend themselves well to Time Series data, since these operations allow you to GROUP BY or Aggregate results over a given time bucket (e.g. Hour, Day, Week, Month, etc.). Next month, I will demonstrate how to use Aggregations for time series analysis and Data Viz.