In this blog post you will deploy your own personal Kraken terminal using the InfluxDB Cloud 2.0 platform. With this terminal you can quickly filter data, plot data and apply math. The first section provides a Hello World project to get up and running with the InfluxDB Cloud 2.0 API and platform. The second section includes scripts to plumb and store Kraken exchange ticker information.
InfluxDB Cloud 2.0 Hello World
Introduction
InfluxDB Cloud 2.0 provides an integrated Time Series Database Platform as a Service (PaaS) with the following features:
- Free (rate limited) tier
- A unified API for ingest, queries, storage and plots
- A functional fourth generation analytic programming language (Flux)
- Integrated control panel and data viz dashboards
- Quick onboarding
![]()
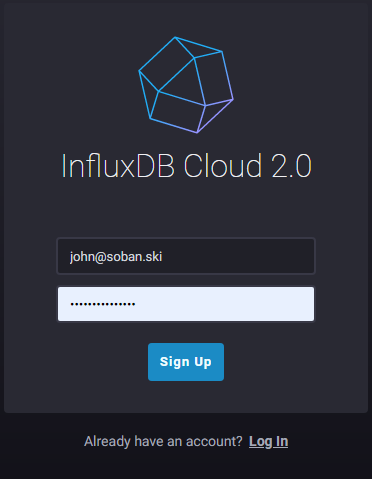
Sign Up
Go to the beta signup page and enter your email address.
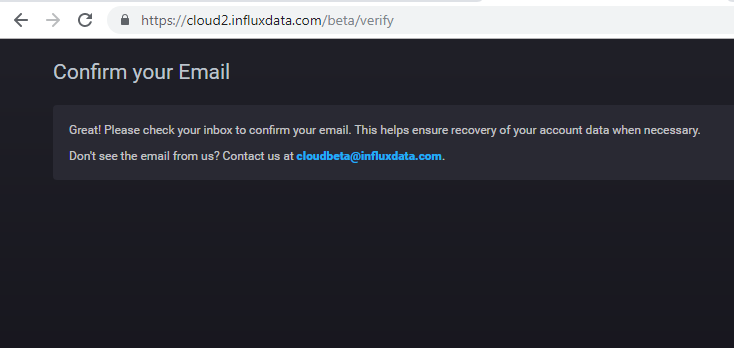
The website tells you to check your email.
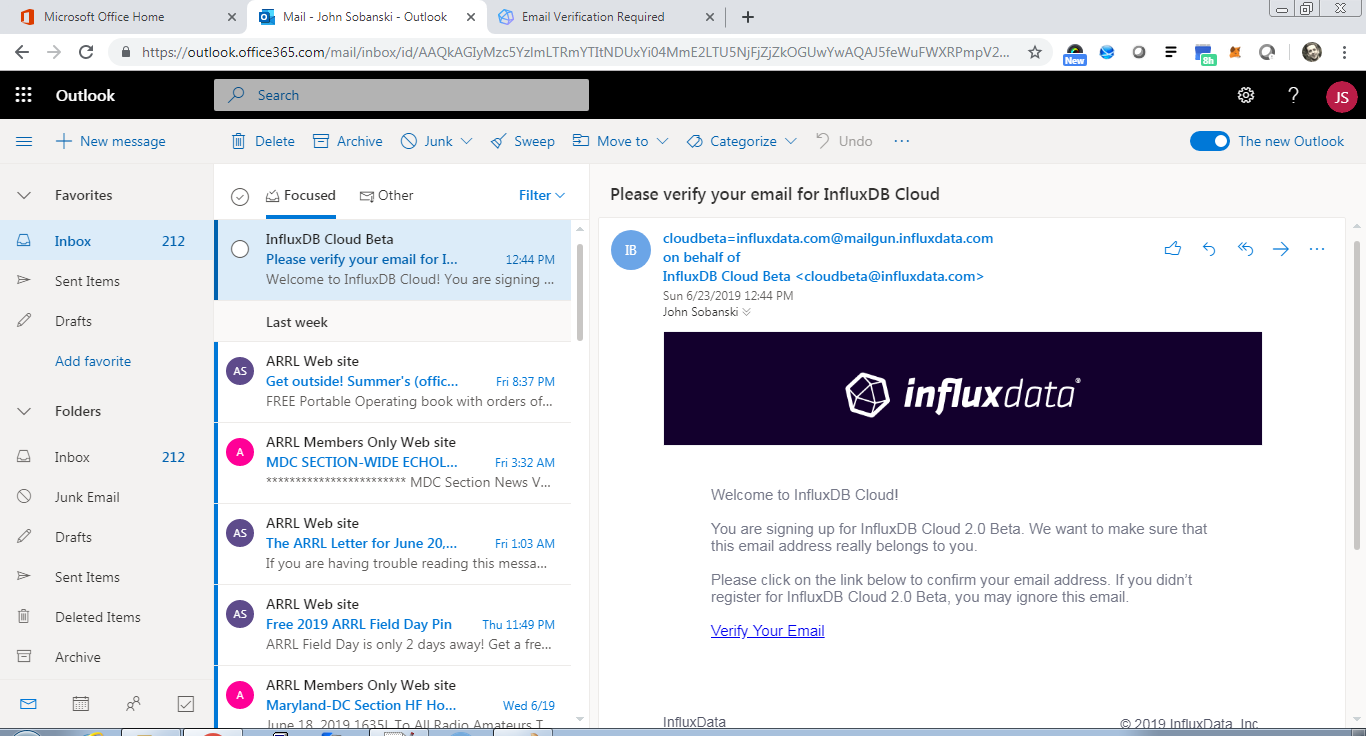
You should see an email from cloudbeta@influxdata.com.
Click Verify Your Email.
Once you verify, InfluxDB will take you to the welcome screen.
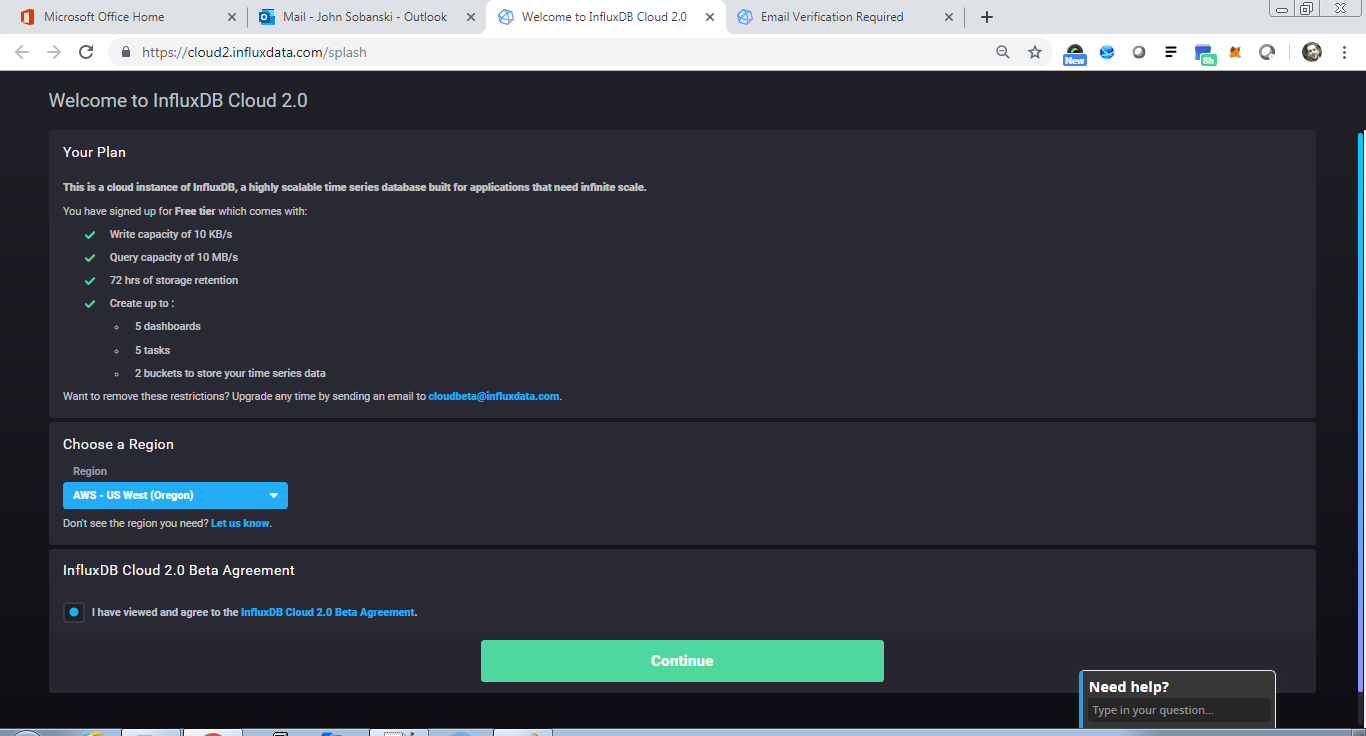
Leave the defaults and click continue.
Configure Platform
Create a Bucket
Create a bucket to store data for analytics and plots.
From the main control panel, click settings.
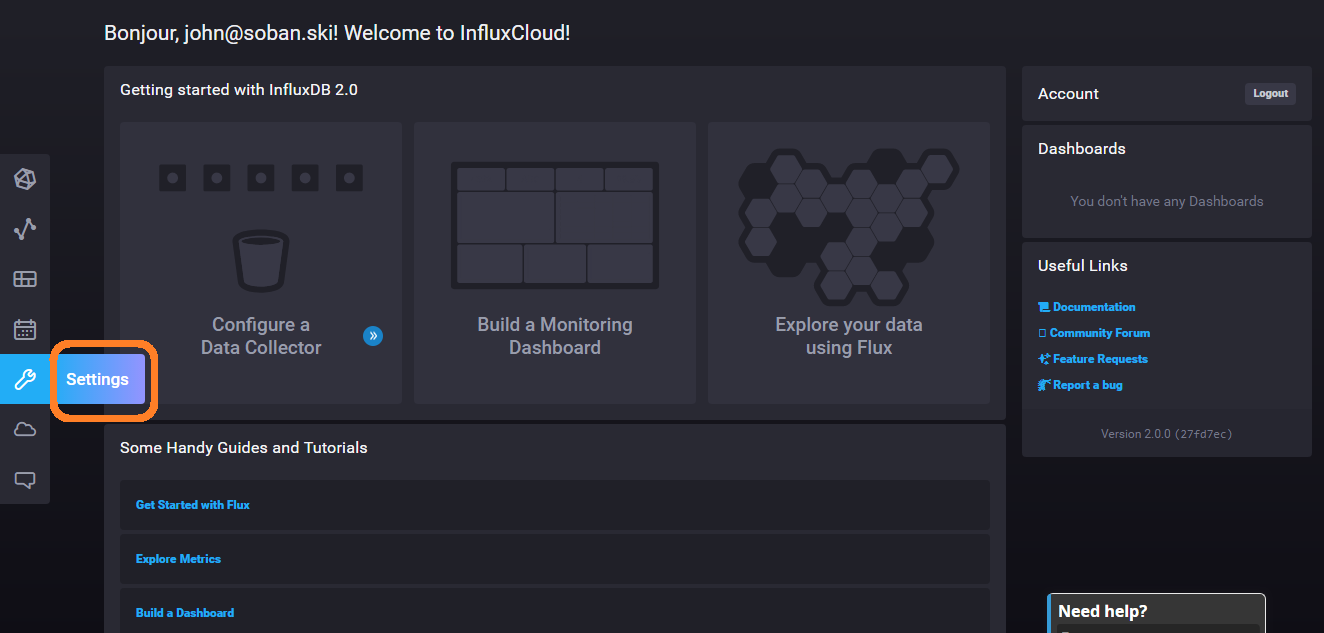
Click Buckets and Create Bucket.
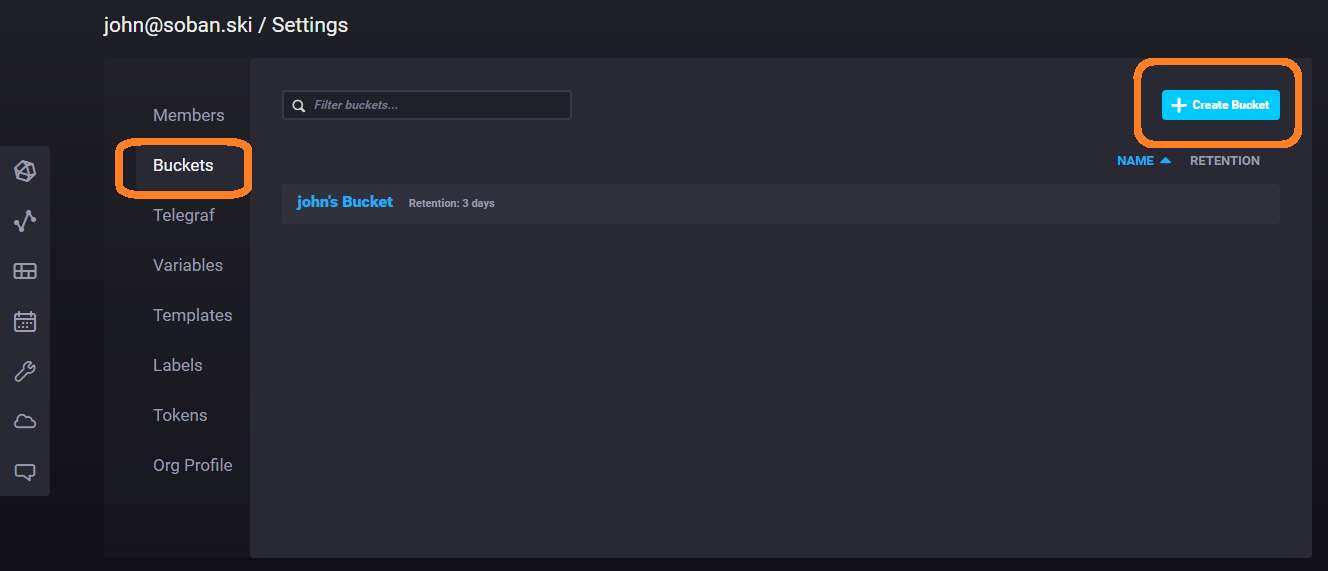
Enter a Name for the bucket.
I named mine Buck.
You will need to set the retention period to three or less days in order to use the free tier.
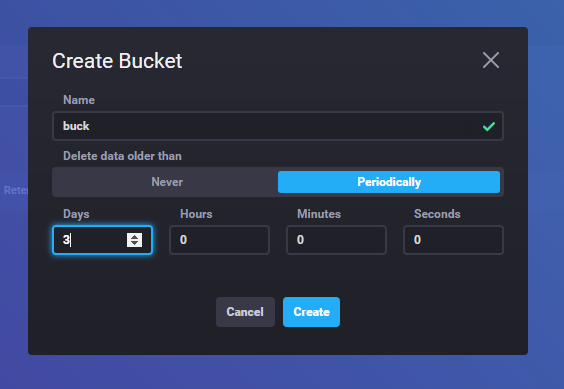
Generate a Token
A token enables programmatic access to your InfluxDB Cloud 2.0 Platform API.
Click Generate on the Tokens Tab.
You can scope the token for read and or write on all buckets or just one of your choosing.
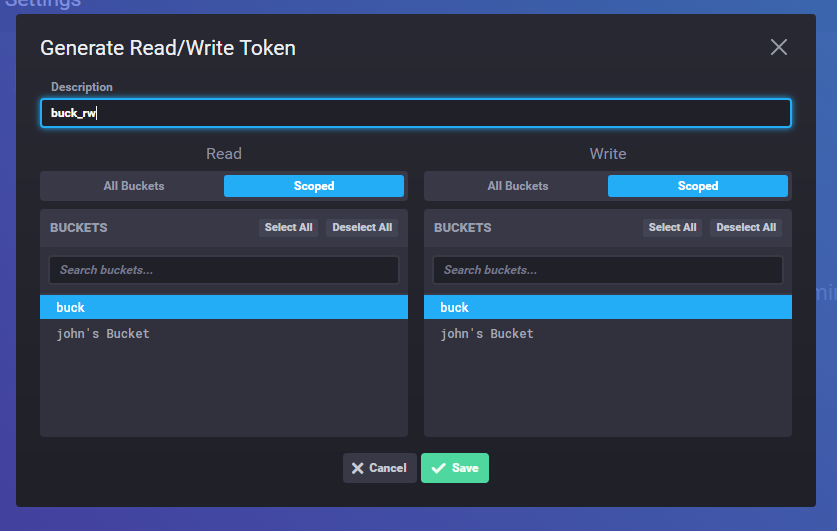
Click Copy to Clipboard and save the token in a local file.
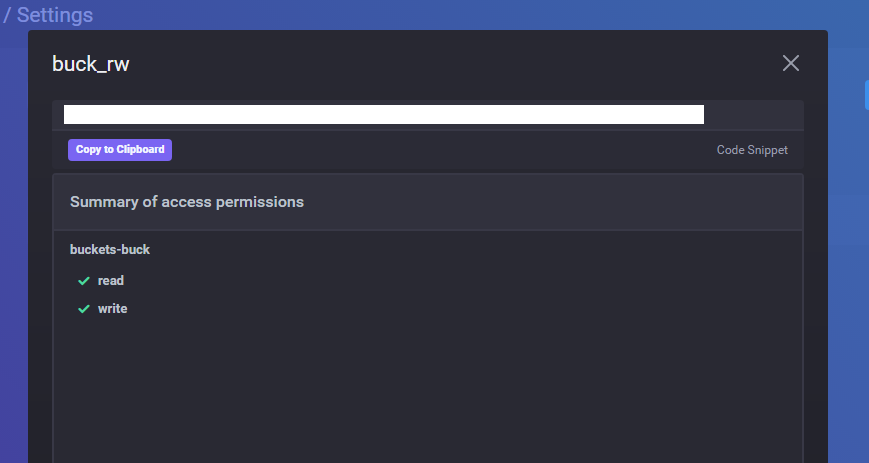
Your Python script (found in the following sections) requires this token.
Find your Org Name
You will find the Org Name in the upper left corner of your console.
You can also find it under the Org Profile tab.
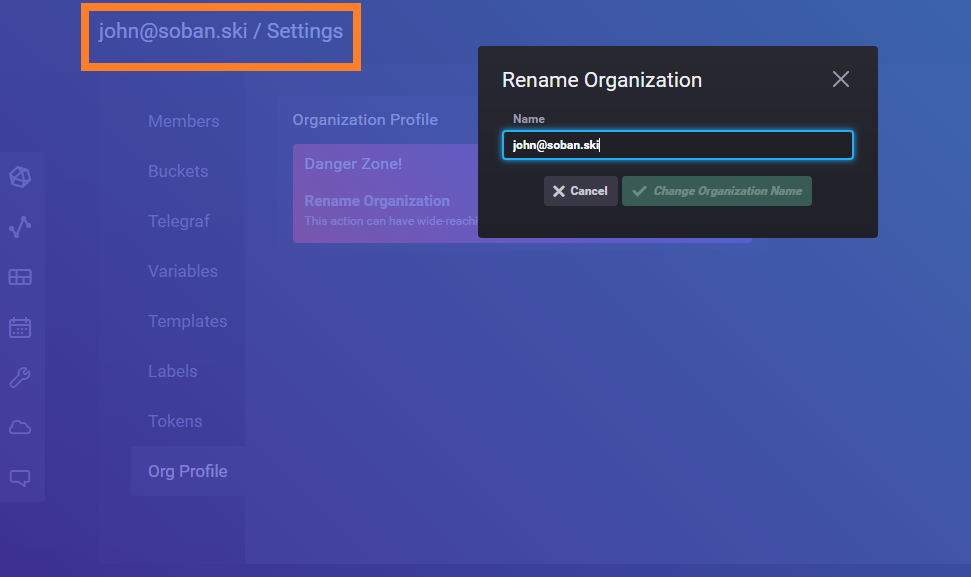
You can see my org name in the picture above.
In the following examples, I will use your@email.com in order to stave off spam bots.
You will need the Org Name in order to hit the InfluxDB Cloud 2.0 platform API.
Hello World Workflow
Put Data
The following script creates an InfluxDB data point encoded in the Influx line protocol.
The script includes a measurement (foo), a tag (bar) key/value pair and a field (anum) key/value pair.
The script sets the key value to a random number.
The script also sets a timestamp in Epoch time.
NOTE: I wrote the following script in Python 3.
#!/usr/bin/env python
import requests
from random import normalvariate
from time import time

INFLUX_TOKEN='Your 88 Character Key' #Put your INFLUX KEY here
ORG="your@email.com" # Put your ORG NAME HERE
INFLUX_CLOUD_URL='us-west-2-1.aws.cloud2.influxdata.com' # Set to the FQDN of your dashboard
BUCKET_NAME='buck' # Your Bucket Name

QUERY_URI='https://{}/api/v2/write?org={}&bucket={}&precision=s'.format(INFLUX_CLOUD_URL,ORG,BUCKET_NAME)

headers = {}
headers['Authorization'] = 'Token {}'.format(INFLUX_TOKEN)

data = 'foo,bar=xyz anum={} {}'.format(normalvariate(3,.5),int(time()))

r = requests.post(QUERY_URI, data=data, headers=headers)

print(r.status_code)
The script uses Python Requests to set the authentication headers and construct the URI.
Run the script a handful of times to push the data.
[centos@ip-172-31-1-82 krakflux]$ ./put_influx.py
204
[centos@ip-172-31-1-82 krakflux]$ ./put_influx.py
204
[centos@ip-172-31-1-82 krakflux]$ ./put_influx.py
204
[centos@ip-172-31-1-82 krakflux]$
If the script executes smoothly, you should see a response code of 204, which means no response.
Get Data
I constructed a Get script to get the data.
Once more, edit the globals to match your information.
#!/usr/bin/env python
import requests

INFLUX_TOKEN='Your 88 Character Key' #Put your INFLUX KEY here
ORG="your@email.com" # Put your ORG NAME HERE
INFLUX_CLOUD_URL='us-west-2-1.aws.cloud2.influxdata.com' # Set to the FQDN of your dashboard
BUCKET_NAME='buck' # Your Bucket Name

QUERY_URI='https://{}/api/v2/query?org={}'.format(INFLUX_CLOUD_URL,ORG)

headers = {}
headers['accept'] = 'application/csv'
headers['content-type'] = 'application/vnd.flux'
headers['Authorization'] = 'Token {}'.format(INFLUX_TOKEN)

data = 'from(bucket: "{}") \
          |> range(start: -1000h) \
          |> filter(fn: (r) => r._measurement == "foo") \
          |> filter(fn: (r) => r._field == "anum") \
          |> filter(fn: (r) => r.bar == "xyz")'.format(BUCKET_NAME)

r = requests.post(QUERY_URI, data=data, headers=headers)

print(r.content)
This script uses the Flux query language to query the data.
It selects all of the data going back about forty two (42) days, and then uses a forward pipe operator to filter the foo measurement, the anum field and bar tags with value xyz.
Each stage of the Flux pipeline applies an operation in the form of a lambda function.
Execute the script to see the data you just pushed to your bucket.
[centos@ip-172-31-1-82 krakflux]$ ./get_influx.py
,result,table,_start,_stop,_time,_value,_field,_measurement,bar
,_result,0,2019-05-13T01:04:28.02436882Z,2019-06-23T17:04:28.02436882Z,2019-06-23T16:59:46Z,3.59310228738,anum,foo,xyz
,_result,0,2019-05-13T01:04:28.02436882Z,2019-06-23T17:04:28.02436882Z,2019-06-23T16:59:54Z,3.0548526208,anum,foo,xyz
,_result,0,2019-05-13T01:04:28.02436882Z,2019-06-23T17:04:28.02436882Z,2019-06-23T16:59:56Z,2.77328244897,anum,foo,xyz
The script returns data in Comma Separated Value (CSV) format.
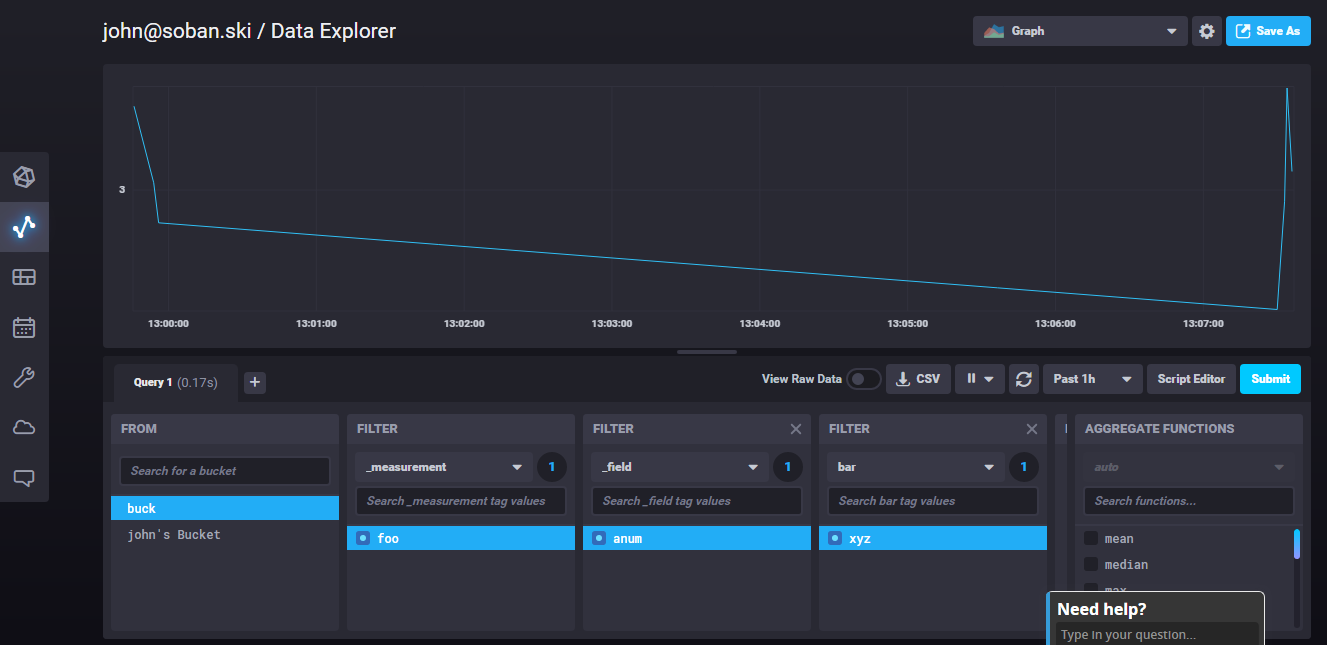
Plot Data
You can now plot the data you stored.
In your console, click Data Explorer.
From there, select the bucket name you set in the Python script and click submit.
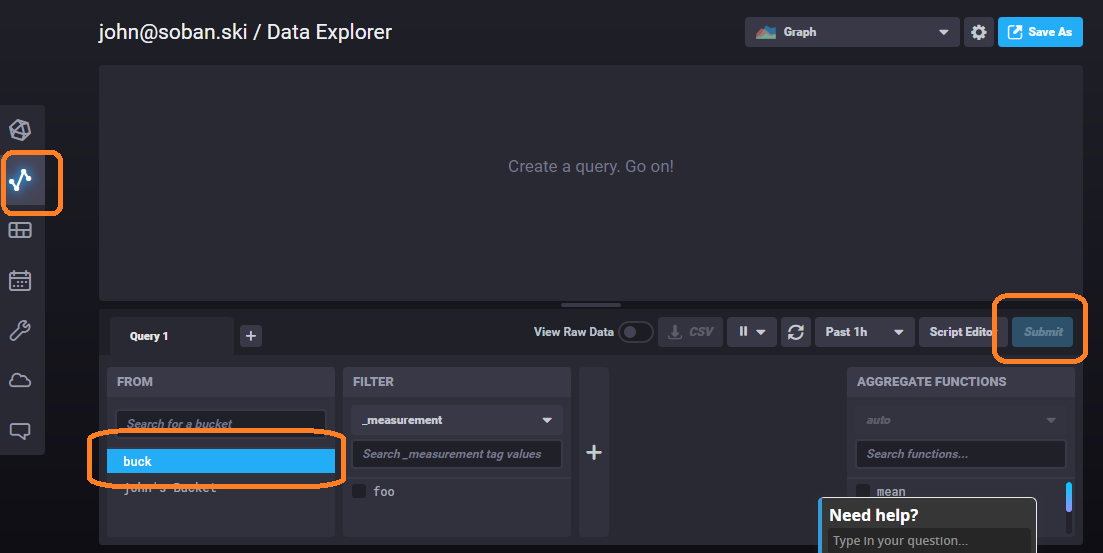
You will see the points that you pushed from the Python script.
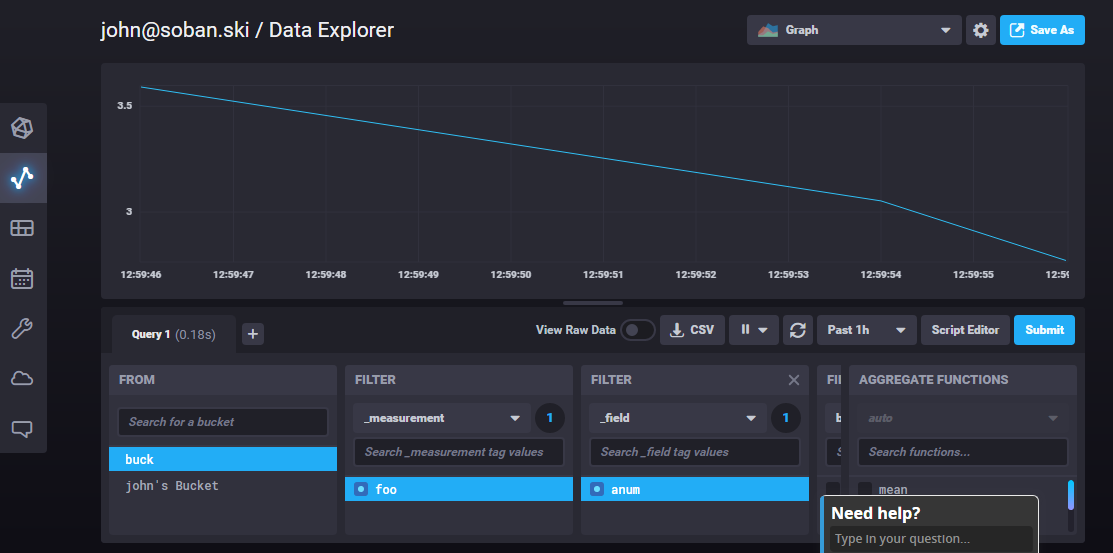
Execute the script from your laptop/ server a few more times and then refresh the plot.
Kraken Terminal
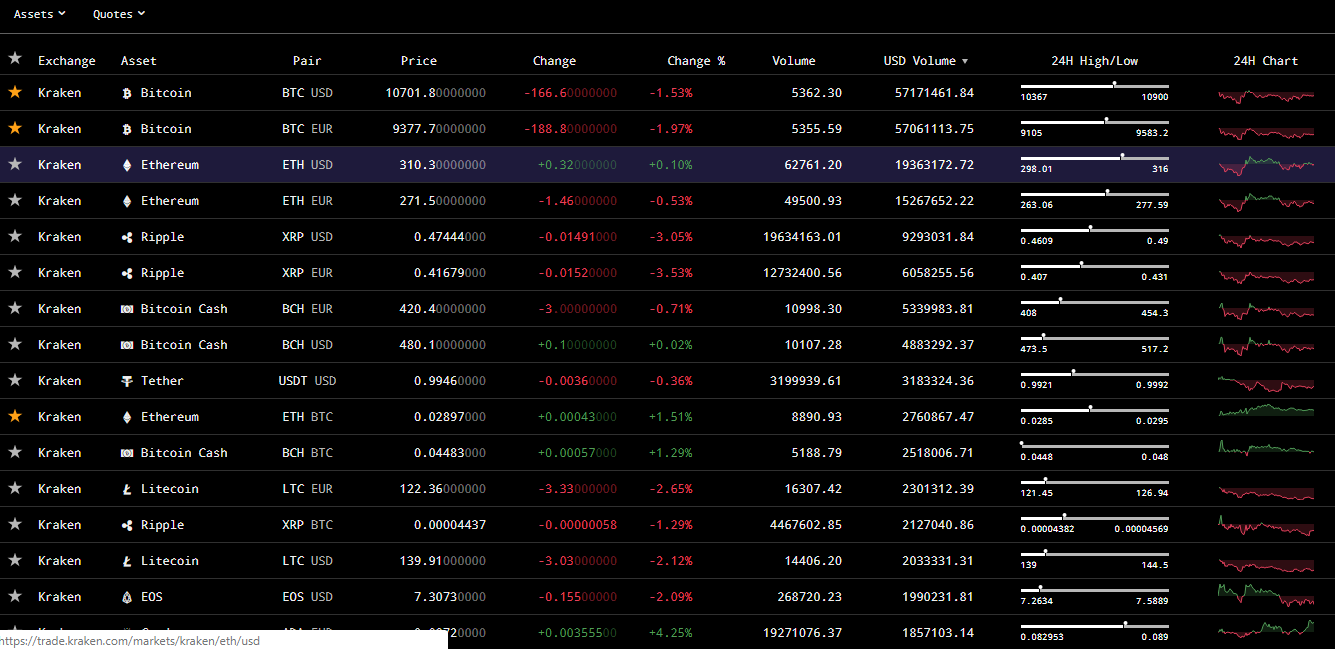
In this section, we will use the Kraken Ticker API to get coin trade data.
![]()
The Kraken API returns trade data in the form of JSON encoded key value pairs.
Our script plumbs the API for data, converts the JSON to InfluxDB line protocol encoded data, and then pushes the data to our InfluxDB Cloud 2.0 integrated platform.
Kraken provides information on several dozen Crypto/ Currency pairs.
The following screen grab illustrates some options.
You can test the API via curl.
For our demo, we select Bitcoin, Litecoin, Stellar and Monero, each against the United States Dollar.
$  curl -XGET https://api.kraken.com/0/public/Ticker?pair=XBTUSD,LTCUSD,EOSUSD,XMRUSD
{"error":[],"result":{"EOSUSD":{"a":["7.325500","100","100.000"],"b":["7.311800","800","800.000"],"c":["7.309600","42.37820000"],"v":["136919.40887890","272595.69649519"],"p":["7.378631","7.407438"],"t":[1074,1740],"l":["7.212000","7.212000"],"h":["7.575000","7.588900"],"o":"7.434200"},"XLTCZUSD":{"a":["139.94000","60","60.000"],"b":["139.74000","1","1.000"],"c":["139.92000","15.00000000"],"v":["5859.12479512","14656.89611531"],"p":["140.51354","140.81599"],"t":[1186,2201],"l":["139.00000","139.00000"],"h":["142.03000","144.50000"],"o":"141.20000"},"XXBTZUSD":{"a":["10724.40000","2","2.000"],"b":["10715.00000","1","1.000"],"c":["10724.80000","0.53495982"],"v":["2731.08942667","5409.39113850"],"p":["10709.30000","10657.30168"],"t":[17853,31636],"l":["10474.00000","10367.00000"],"h":["10883.30000","10900.00000"],"o":"10663.80000"},"XXMRZUSD":{"a":["116.66000000","74","74.000"],"b":["116.41000000","4","4.000"],"c":["116.41000000","1.43000000"],"v":["1962.16627966","4972.87900067"],"p":["115.44303740","114.63532852"],"t":[586,1028],"l":["113.51000000","111.90000000"],"h":["116.62000000","117.13000000"],"o":"114.80000000"}}}
That's a lot of data!
The following Python script helps to clean it up.
#!/usr/bin/env python
import io,json,requests
from time import time

INFLUX_TOKEN='Your 88 Character Key' #Put your INFLUX KEY here
ORG="your@email.com" # Put your ORG NAME HERE
INFLUX_CLOUD_URL='us-west-2-1.aws.cloud2.influxdata.com' # Set to the FQDN of your dashboard
BUCKET_NAME='buck' # Your Bucket Name

PAIR_LIST = 'XBTUSD,LTCUSD,EOSUSD,XMRUSD'
KRAKEN_API = 'https://api.kraken.com/0/public/Ticker?pair={}'.format(PAIR_LIST)

kr = requests.get(KRAKEN_API)
r = json.loads(kr.content.decode('utf-8'))

INFLUX_QUERY_URI='https://{}/api/v2/write?org={}&bucket={}&precision=s'.format(INFLUX_CLOUD_URL,ORG,BUCKET_NAME)

headers = {}
headers['Authorization'] = 'Token {}'.format(INFLUX_TOKEN)

ts = int(time())
f = io.StringIO()

lookup = {}
lookup['b'] = 'bid'
lookup['a'] = 'ask'
lookup['c'] = 'closed'
lookup['v'] = 'volume'
lookup['p'] = 'weighted_mean_vol'
lookup['t'] = 'trade_qty'
lookup['l'] = 'low'
lookup['h'] = 'high'
lookup['o'] = 'open'

for pair in r['result'].keys():
  for field in r['result'][pair].keys():
    value = r['result'][pair][field]
    if type(value) == list:
      value = value[0]
    f.write('kraken,pair={} {}={} {}\n'.format(pair,lookup[field],float(value), ts))

data = f.getvalue()

resp = requests.post(INFLUX_QUERY_URI, data=data, headers=headers)

print(resp.status_code)
The script pulls the Kraken Crypto/ Fiat Pairs listed in the PAIR_LIST variable.
The script iterates over the nested JSON and converts the data to the InfluxDB line protocol.
We set the measurement name to kraken, create a tag named pair and then create a key/value field pair for each line of data the Kraken API returns.
The lookup dictionary converts the cryptic Kraken API response codes to human readable text.
The script then creates the proper requests headers and pushes the data to our bucket.
Run the script a few times.
You can optionally create a bash for loop to run it on a uniform frequency.
$ while true; do ./put_kraken.py; sleep 60; done
Plot the Data
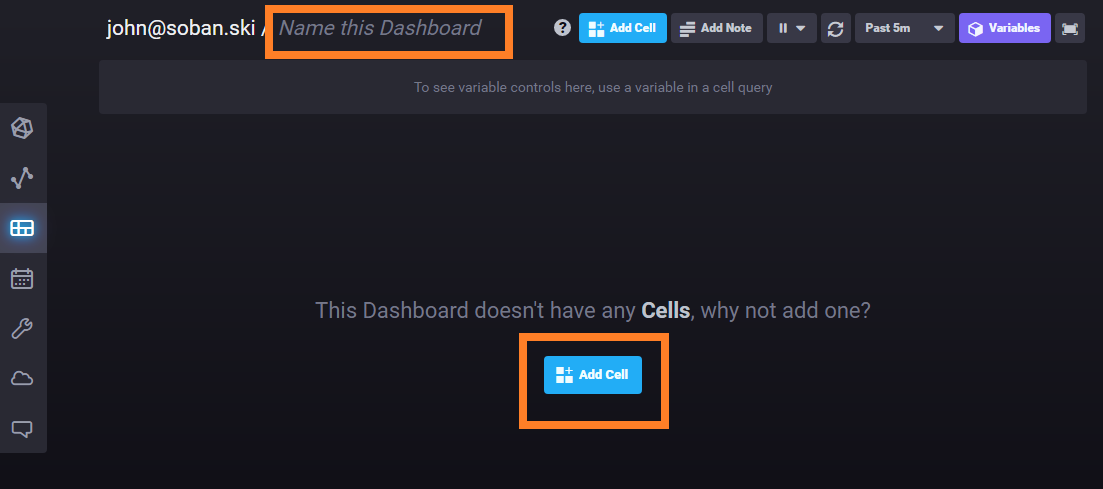
Create a Dashboard for the new Kraken data.
Click Create Dashboard under Dashboards.
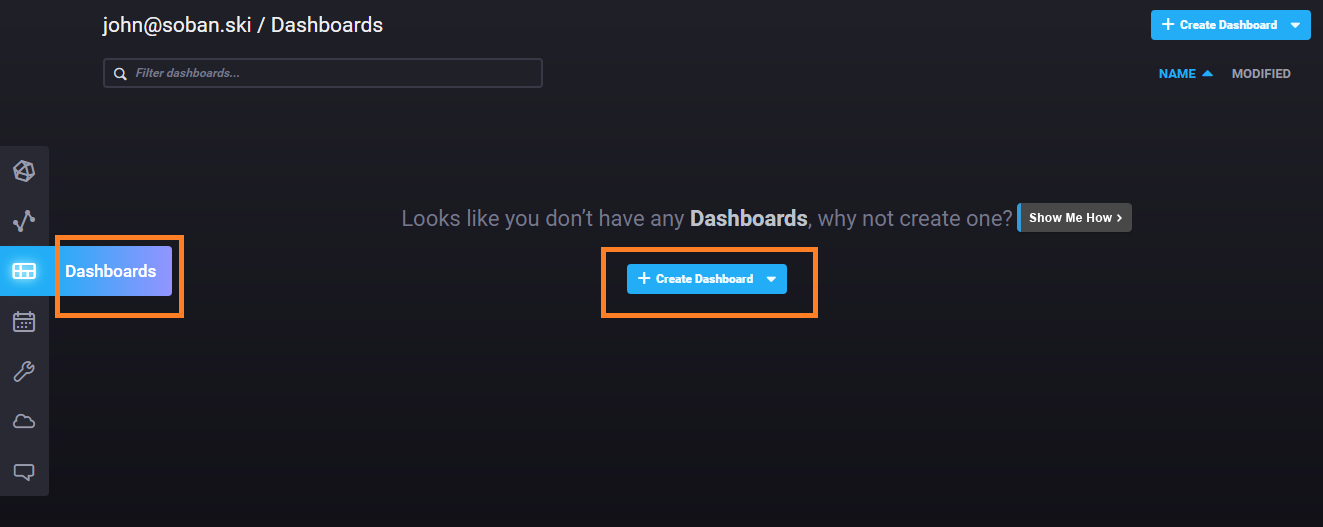
Click the Add Cell button to add a cell.
You can optionally name the dashboard.
You will first add the Bitcoin close price.
Follow the blue boxes on the screen grab below to select your bucket (buck), measurement (kraken), field (last closed price) and tag (the Bitcoin/USD pair).
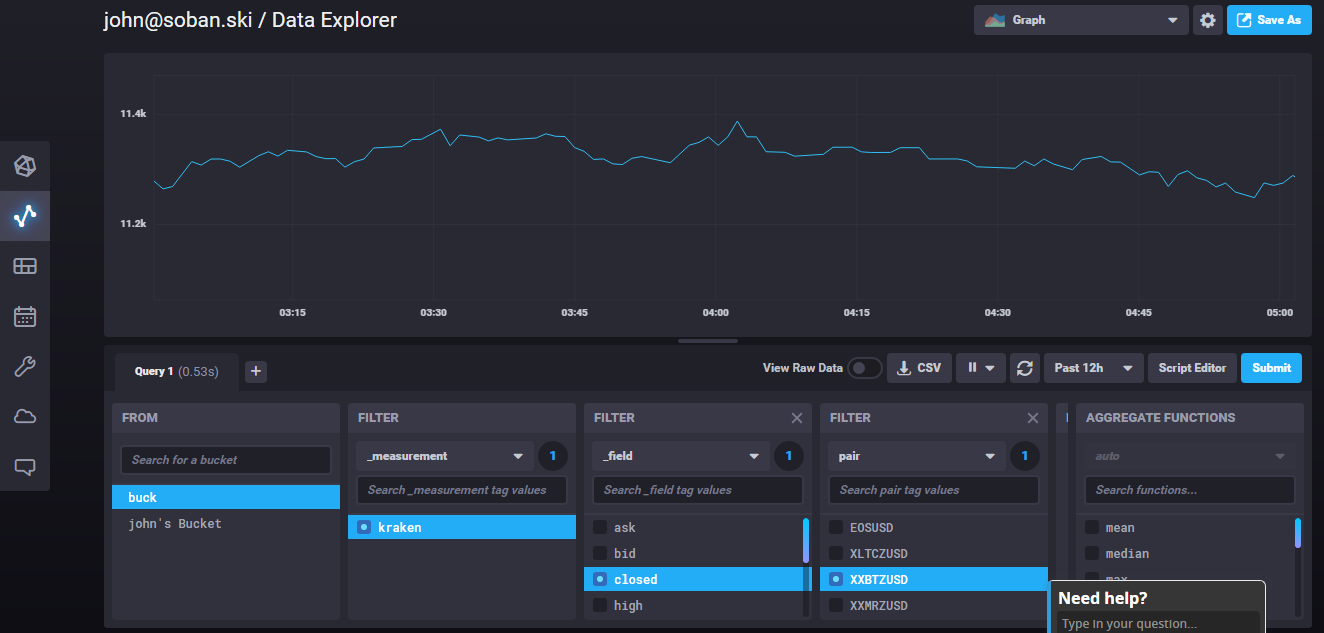
Save the cell and add it to your Dashboard.
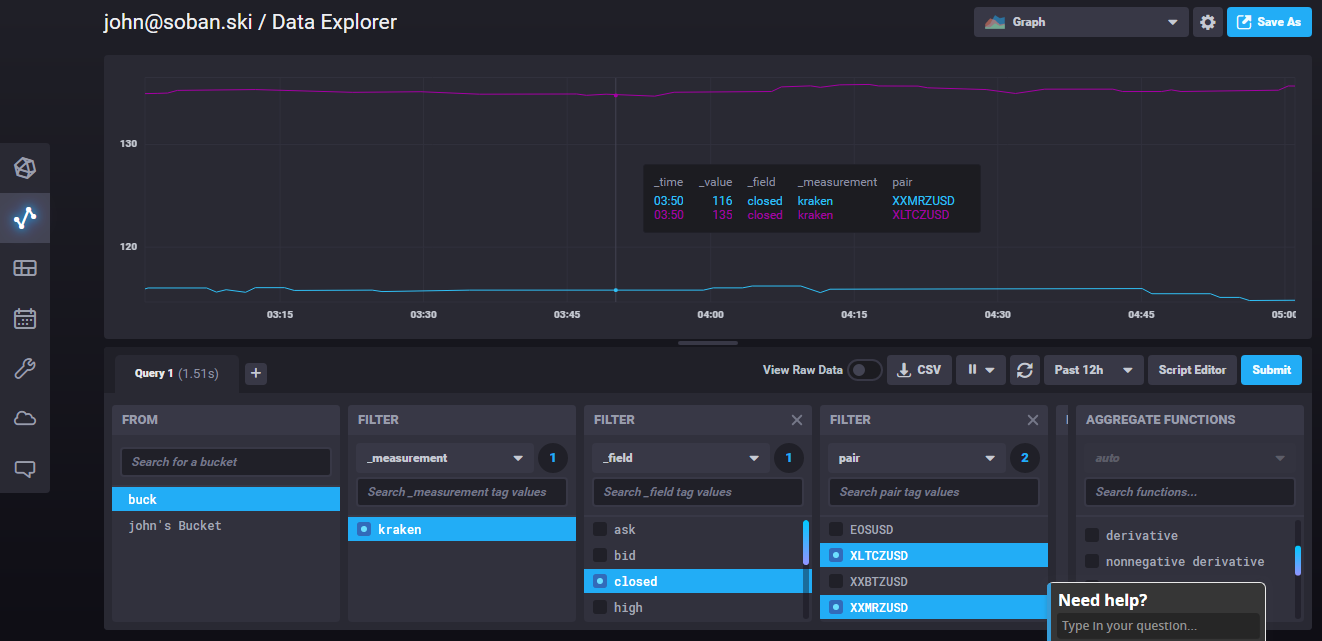
You can plot any/ all of the pairs on the graph by clicking their tag values.
Litecoin and XMR, for example, have similar prices and plot nicely together.
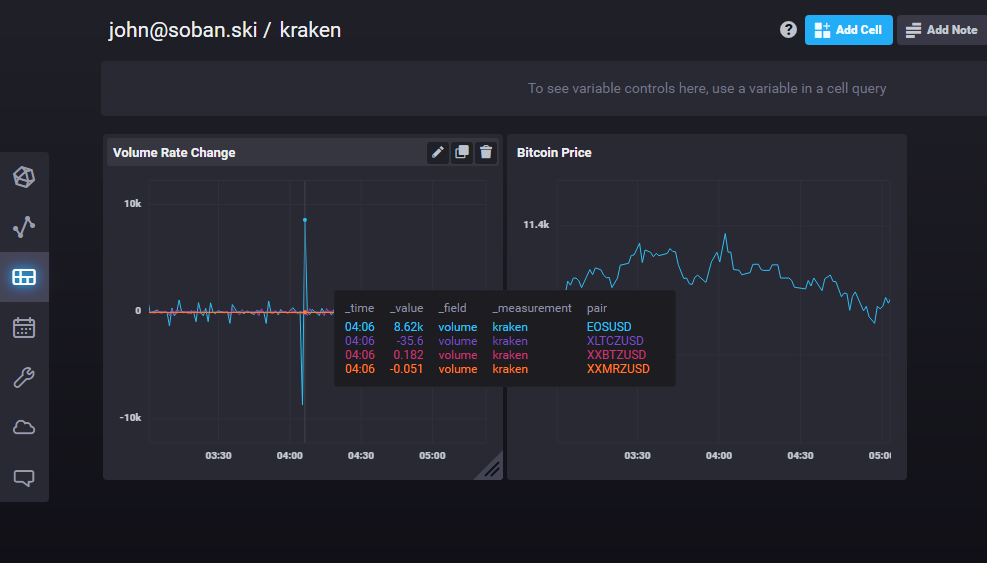
Math in Action
Let's say you wanted to plot the rate of change (velocity) for the Bitcoin price.
Go back to your grade school calculus and remember that derivative gives us this number.
Simply click derivative under AGGREGATE FUNCTIONS to apply this math.
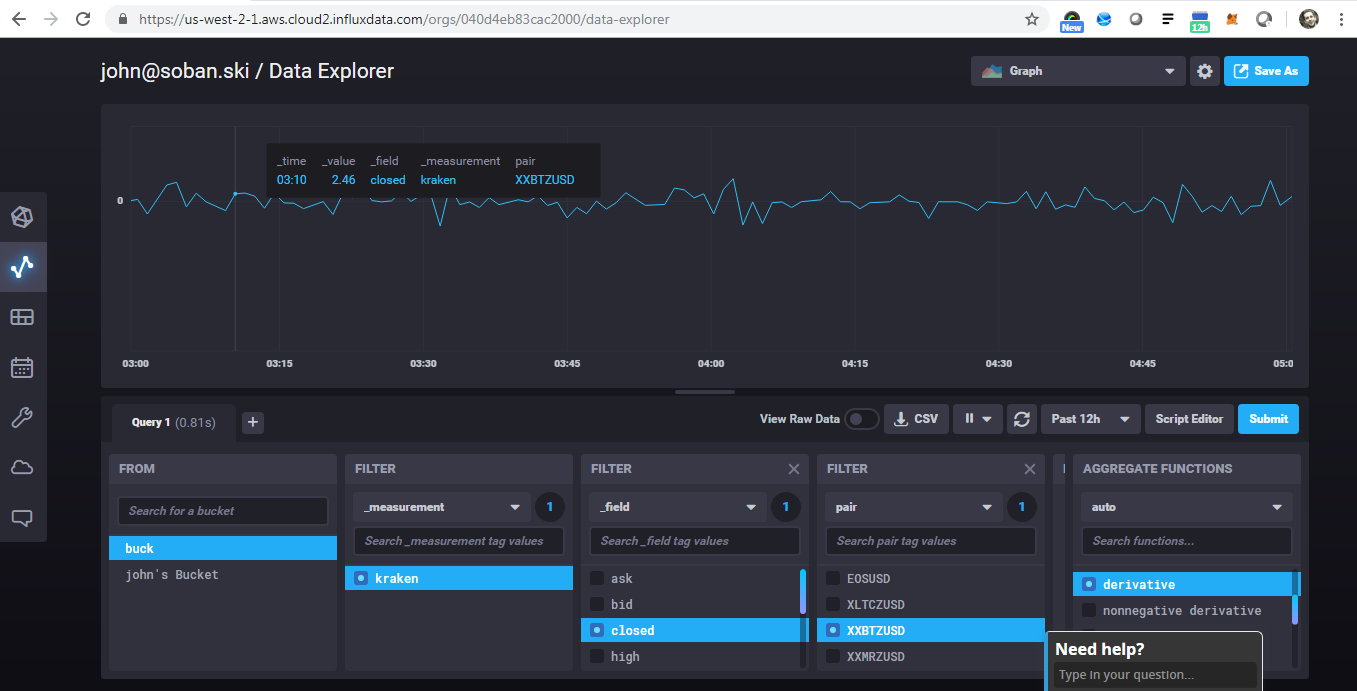
You can add cells to your dashboard for situational awareness.
I created a cell that plots the velocity of all of the coins (against USD).
You can see that Stellar experienced a spike around 4am.
Conclusion
I hope you appreciate the power of the preceding project. You demonstrated how to pull data from a remote API and push the data to a (free as in beer), cloud based Time Series Database as a service. The InfluxDB Cloud 2.0 platform provides easy to use tools to plot, filter and perform math on the plumbed data.
Next month, I will demonstrate how to set up a bot that will alert you on volume spikes for different coins.